| Item | Details |
|---|---|
| Invention Name | Mercator Projection |
| Short Definition | Conformal world map projection where rhumb lines plot as straight lines |
| Approximate Date / Era | 1569 — Certain |
| Geography | European cartography with global nautical use |
| Inventor / Source Culture | Gerardus Mercator (individual inventor) |
| Category | Navigation, Cartography, Geodesy |
| Importance |
|
| Need / Reason It Emerged | Reliable course plotting on sea charts, especially over long stretches |
| How It Works | Cylindrical conformal graticule with latitude spacing that increases toward the poles |
| Material / Technical Basis | Mathematics (projection equations) + engraved chart production |
| First Main Use | Nautical charts and marine navigation |
| Spread Route | European chartmakers → hydrographic charting → worldwide adoption |
| Derived Developments | Chart standards, Transverse Mercator families, Web Mercator tiling |
| Impact Areas | Navigation, trade, education, digital mapping |
| Debates / Different Views | World map comparison limits due to area distortion at high latitudes |
| Precursors + Successors | Earlier sea charts + graticule maps → Mercator → modern projection families |
| Key People / Institutions | Mercator; later hydrographic offices and mapping agencies |
A straight line on a Mercator chart can represent a constant compass heading. That single trick—simple on paper, tough in math—helped make sea navigation more predictable, and it still shapes how many people picture the planet on flat screens.
Table Of Contents
What The Mercator Projection Is
The Mercator projection is a way to draw latitude and longitude as a clean rectangle: meridians become straight vertical lines, and parallels become straight horizontal lines. The special part is not the grid. It is the rule for spacing that grid.
What It Preserves
- Local angles (the projection is conformal)
- Bearings for constant-course lines drawn straight
- Small shapes look “right” in a neighborhood sense
What It Changes
- Area (high latitudes expand on the page)
- Distance (scale varies by latitude)
- Perspective for world-sized comparisons
People often describe Mercator with a cylinder picture. It can help the imagination, sure. Yet the projection is ultimately defined by equations, not a craft trick with paper and tape.
Why Mercator Drew It For Navigators
Mercator presented the rectangular Mercator projection in 1569, and nautical chartmakers adopted it because a straight course line on the chart can represent a constant course at sea (a rhumb line, also called a loxodrome). (Details-2)
If that sounds almost too neat, it is because the projection “pays” for it with distortion elsewhere. That trade is the heart of Mercator: directional clarity in exchange for size inflation as latitude rises.
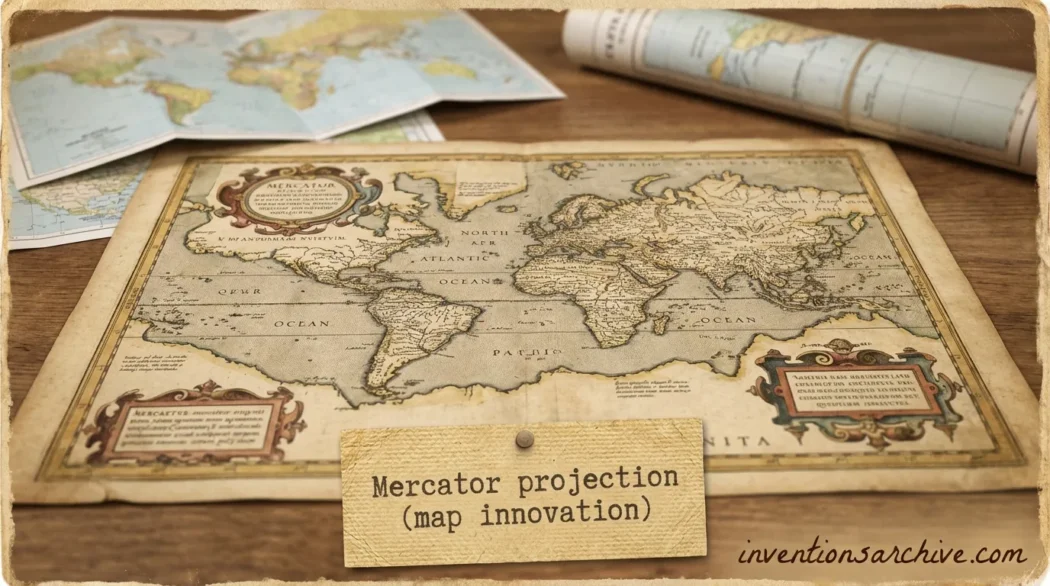
The original 1569 wall map is widely cited under its Latin title Nova et Aucta Orbis Terrae Descriptio ad Usum Navigantium Emendate Accommodata, credited to Gerardus Mercator and dated to 1569. (Details-1)
How Angles Stay True and Areas Stretch
The Mercator projection is conformal. In plain terms, at a very small scale it keeps angles intact, so local shapes behave. The cost shows up fast as you move away from the equator: the map must separate latitude lines more and more to keep that angular truth.
A Handy Mental Model
- Near the equator, scale is closest to normal.
- At higher latitudes, the map acts like it is zooming in.
- So yes, places nearer the poles can look bigger on a world map. Not a mistake—just math.
| Latitude | Local Scale Multiplier | Plain Meaning |
|---|---|---|
| 0° | ~1.00× | Baseline |
| 30° | ~1.15× | Small expansion |
| 45° | ~1.41× | Noticeable |
| 60° | ~2.00× | Twice the local scale |
| 80° | ~5.76× | Very large expansion |
Those multipliers come from a compact relationship on the spherical form: scale grows roughly like sec(latitude). That is why the poles cannot appear as normal points on a classic Mercator world map—spacing would run off to infinity.
The Math Behind The Grid
Mercator’s core move is to keep longitude proportional left-to-right, then stretch latitude by a logarithmic function. The result is a projection that is tidy to read and predictable in its distortions.
A Standard Spherical Form
x = R · (λ − λ₀)
y = R · ln( tan(π/4 + φ/2) )
Here φ is latitude, λ is longitude, and R is a chosen Earth radius for the spherical model. A concise statement of these forward and inverse relations appears in university lecture notes on spherical projections. (Details-3)
On an ellipsoidal Earth model, formulas change in the details, but the idea stays: keep angles, accept that scale varies with latitude.
Rhumb Lines, Great Circles, and Real Routes
A rhumb line crosses every meridian at the same angle. That makes it a constant-bearing path—steady steering, steady heading. On a Mercator chart, a rhumb line can be drawn as a straight segment, which is exactly why navigators liked it. (Details-2)
Now the twist: the shortest path on a sphere is a great circle. Great circles usually appear as curves on Mercator (except along the equator and along meridians). So a straight line on Mercator often means “constant heading,” not “minimum distance.”
- Straight on Mercator: rhumb line (constant bearing)
- Shortest on a globe: great circle (usually curved on Mercator)
- Both are valid ideas. They answer different questions.
Mercator Variants and Close Relatives
“Mercator” can mean a family of related projections. The names sound similar, but the geometry changes. A little. Sometimes a lot.
Common Forms
- Normal Mercator: cylinder aligned with Earth’s axis; equator is the natural reference line.
- Secant Mercator: scale is exact along two standard parallels (a practical way to reduce distortion in a band).
- Transverse Mercator: cylinder rotated; best for mapping long north–south regions (the logic behind many grid systems).
- Oblique Mercator: axis is tilted to align distortion with a chosen great circle, often used for corridor-style regions.
For a deep technical catalog of projection equations (including forward and inverse forms across many families), cartographers often cite the USGS reference Map projections: A working manual. (Details-4)
Where The Projection Shows Up Today
The classic Mercator stays tightly linked to nautical charting, and its descendants appear in digital mapping. The best-known modern variant is often called Web Mercator, used for tiled web maps in a form registered as WGS 84 / Pseudo-Mercator.
A Few Precise Registry Facts
- Name in the EPSG dataset: WGS 84 / Pseudo-Mercator
- Code: 3857
- Extent: World −85° to +85° latitude (poles excluded)
- Remark (as recorded): not a recognised geodetic system and uses a spherical development of ellipsoidal coordinates
Those points come directly from the EPSG dataset entry for CRS 3857. (Details-5)
So when a phone map feels smooth as you zoom in and out, Mercator’s logic is often in the background. Not always the pure 1569 form, but the family resemblance is easy to spot: a rectangular grid that behaves nicely for angles.
Common Misunderstandings
- “It shows true sizes.” No. Mercator is not equal-area; high-latitude areas expand.
- “Straight means shortest.” On Mercator, straight often means constant bearing, not minimum distance.
- “It is one fixed thing.” There are variants (normal, transverse, oblique, web-focused forms).
- “Web Mercator is perfect geography.” It is built for display and tiling; the registry even notes limits and remarks about geodetic recognition. (Details-5)
Frequently Asked Questions
What Does “Conformal” Mean For The Mercator Projection?
It means the projection preserves local angles. Small shapes keep their angle relationships, so directions on the grid behave consistently, even though area and distance change with latitude.
Why Can’t A Classic Mercator Map Show The Poles?
Because the spacing of parallels grows without bound as latitude approaches 90°. The mathematics drives the map height toward infinity, so practical maps stop short of the poles.
Is A Straight Line On Mercator Always The Shortest Route?
No. A straight line on Mercator often represents a rhumb line (constant bearing). The shortest path on a globe is usually a great circle, which appears curved on Mercator in most cases.
Why Do Nautical Charts Still Use Mercator?
For many navigation tasks, the ability to draw a constant-course line as a straight segment is convenient, and that property is a classic reason given for Mercator use in nautical charting. (Details-2)
Is Web Mercator The Same As Mercator?
It is a variant used for web mapping and visualization. The EPSG dataset records it as WGS 84 / Pseudo-Mercator (code 3857) with a defined latitude extent that excludes the poles. (Details-5)
What Should Be Used For World Maps When Area Comparison Matters?
Cartographers often choose an equal-area projection for area comparisons. Mercator is built to preserve angles, so it is not designed to keep areas proportional across the whole world.